


Design comparison
Solution retrospective
LEARNINGS :
-
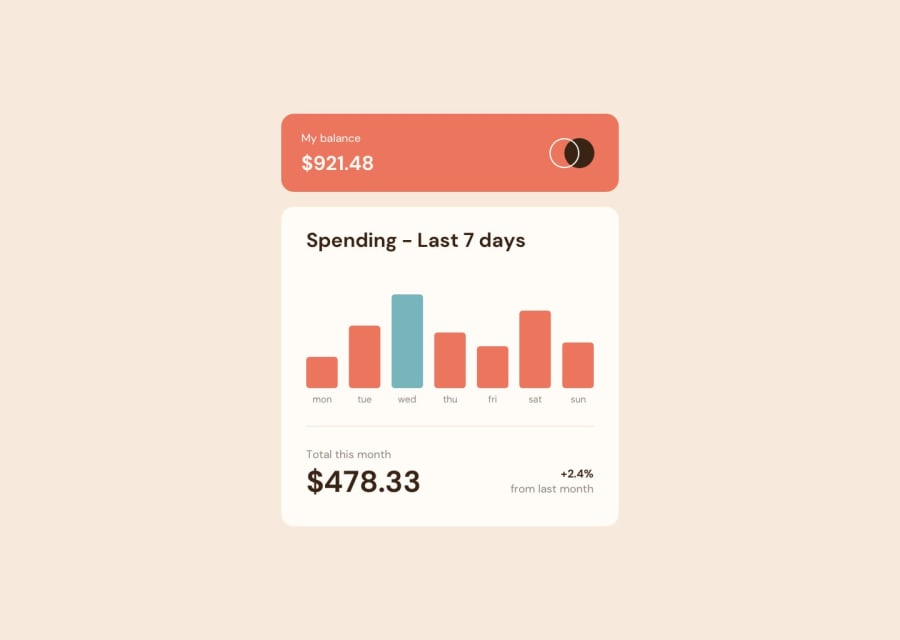
During the "Expenses chart component" challenge on Frontend Mentor, I had the opportunity to learn and use the HTML Canvas element.
-
Before this challenge, I had very very limited experience with Canvas. However, this challenge required me to create a bar chart using Canvas to display data about expenses.
-
To accomplish this task, I had to create a script that would take data about expenses and generate a bar chart with a legend, axes, and labels.
-
I found that using Canvas allowed me to create a dynamic and interactive chart that could be updated with new data and animations. I also appreciated how Canvas allowed me to have fine-grained control over the appearance of the chart, such as the thickness of the bars and the color of the legend.
Through this challenge, I learned how to leverage the power of Canvas to create complex and dynamic visualizations on a web page. I plan to continue exploring Canvas and its capabilities in future projects.
Feedbacks are most appreciated.
Thanks : )
Community feedback
Please log in to post a comment
Log in with GitHubJoin our Discord community
Join thousands of Frontend Mentor community members taking the challenges, sharing resources, helping each other, and chatting about all things front-end!
Join our Discord