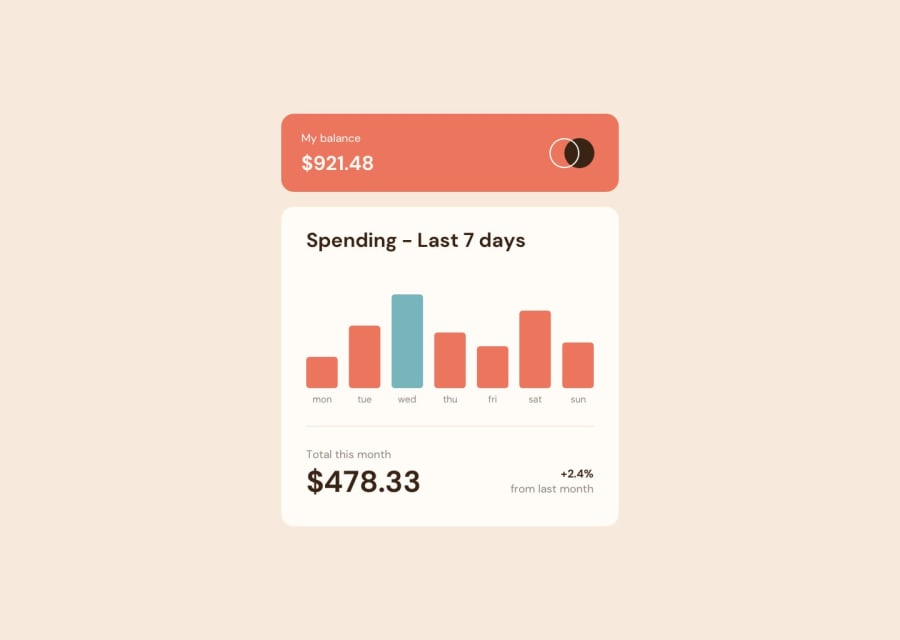
Design comparison
Solution retrospective
Building Chart according to the given model is a little bit difficult. but after knowing about chart js and it's features it became easier process.
The Next Challenge was to connect the given JSON data with our bar chart. after some research i find out what is the problem and got the solution.
The only problem I am Facing now is to Edit the Tooltip Label of Bar Chart. I want to add an Extra "$" sign before the amount in tooltip, But I Can't do that. If anyone know about that Please give me solution❤️
Community feedback
- @daniloarcidiaconoPosted over 2 years ago
You can try the before selector like this:
<your-selector>::before { content: "$"; }0@sahalakmaPosted over 2 years ago@daniloarcidiacono is this code for React JS ?. I have done my project only by using javascript , html & css
0@daniloarcidiaconoPosted over 2 years ago@sahalakma no, it's CSS code... you'll have to figure out the CSS rule to select the HTML element that contains the amount
edit: I see that the chart is actually a canvas, so you can't use a CSS selector 🙁
Did you try adding the dollar sign when you map the data points?
const labelsAmount = datapoints.map(function(index) {
        return '$' + index.amount;
    });
Marked as helpful0
Please log in to post a comment
Log in with GitHubJoin our Discord community
Join thousands of Frontend Mentor community members taking the challenges, sharing resources, helping each other, and chatting about all things front-end!
Join our Discord
