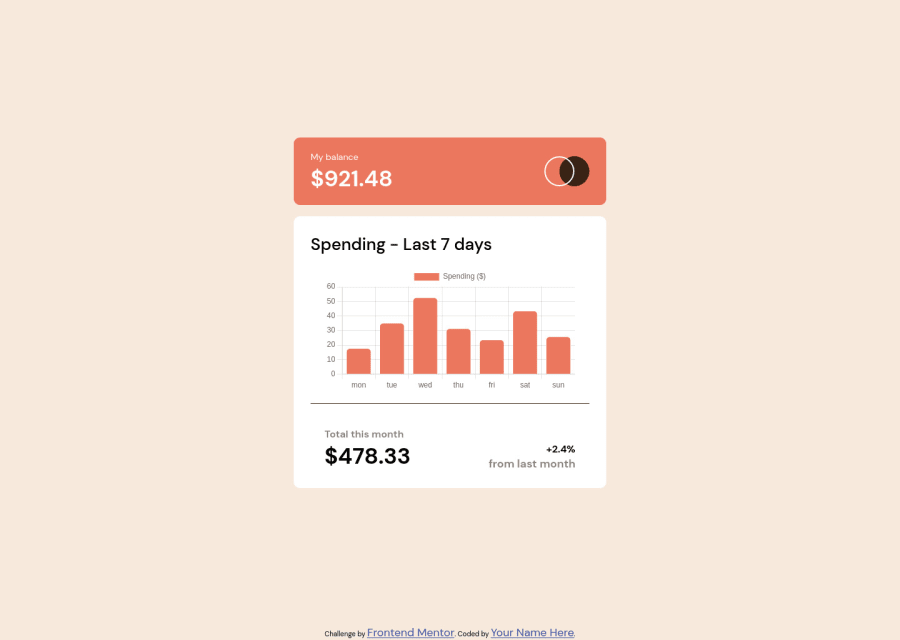
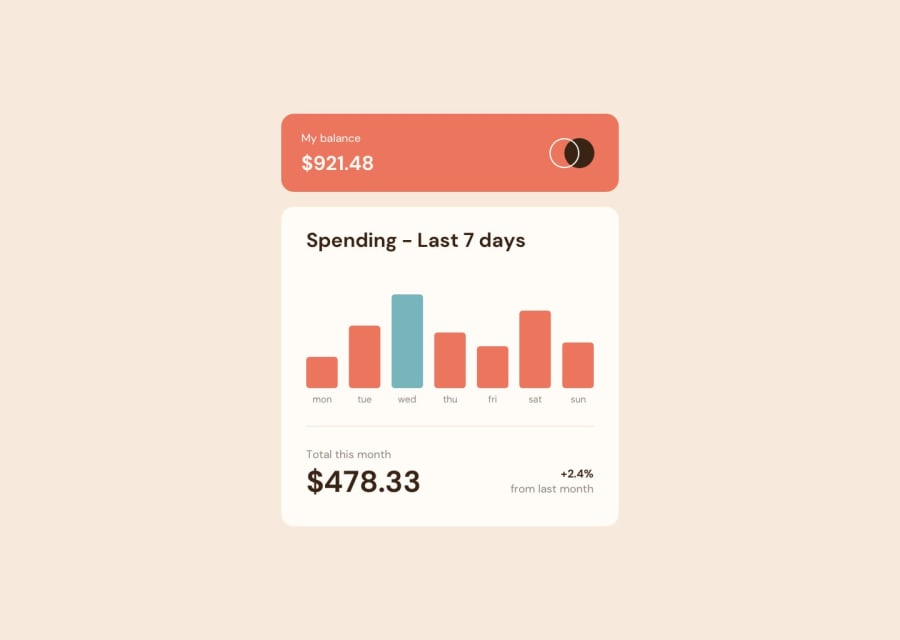
Responsive Expenses-tracker with Vanilla JS, SCSS and Chart.js


Design comparison
Solution retrospective
Hello, hope you like my solution, any question and advice will be greatly apreciative
Community feedback
- @SrHatcherPosted almost 2 years ago
Hello!
Nice Solution, I also used chart JS to make the chart! It was very hard for me to read only the documentation, luckly I found a youtube channel that makes tutorials about how to personalize the charts, this video may help you, I'ts abou how to change the cursor when we hover a Bar.
I hope that channel Helps you. Good luck! :)
Marked as helpful0@RidiscusPosted almost 2 years ago@SrHatcher hello I am currently doing this challenge but I have trouble displaying the graphic chart despite my scss file
0@SrHatcherPosted almost 2 years ago@Ridiscus sorry, I think I don't understand your problem. If you can't show the graphic in the browser that means you're missing something in your html code (if you're using chartJS), probably the script that connects your project with the chartJS CDN
0@RidiscusPosted almost 2 years ago@SrHatcher ok cool it was exactly my problem ( CDN ) thank for your help
1


Please log in to post a comment
Log in with GitHubJoin our Discord community
Join thousands of Frontend Mentor community members taking the challenges, sharing resources, helping each other, and chatting about all things front-end!
Join our Discord