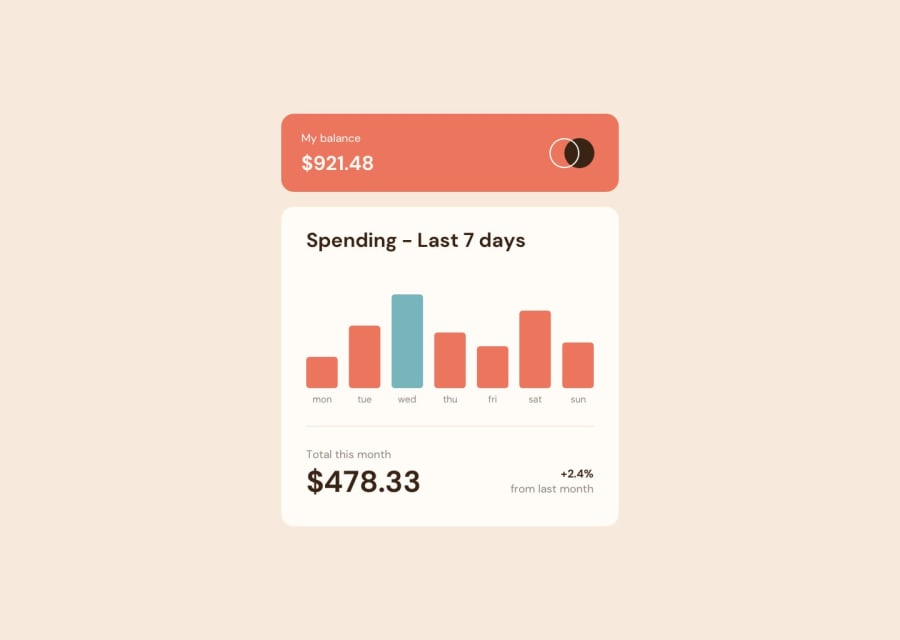
Design comparison
Solution retrospective
Hi everybody! 👋
Frontend Mentor - Expenses chart component solution
This is a solution to the Expenses chart component challenge on Frontend Mentor.
The challenge 🎯
Users should be able to:
- View the bar chart and hover over the individual bars to see the correct amounts for each day
- See hover states for all interactive elements on the page
- See the current day’s bar highlighted in a different colour to the other bars
- View the optimal layout for the content depending on their device’s screen size
Links 🔗
- Solution: Github Repository
- Solution: Github Page
My process ⚙️
Built with 🛠️
- Semantic HTML5 markup
- CSS custom properties
- Flexbox
- Sass - Css preprocessor
- Mobile-first workflow
- Javascript - for the bar functionality and JSON data file
What I learned 📚
This challenge allowed me to consolidate and expand my knowledge in javascript, especially in: -work with data from a json file -Management of events. -Functions of validation. -Creation of regular expressions. -Manipulation of the DOM.
In turn, this was the first project using SASS to style my html, getting into the use of: -Nestings -Partial -Mixins -Extends
// importing a json file to javascript
import data from '../data.json' assert {type: 'json'};
console.log(data);
}

// obtaining the values to modify the height of each bar
let maxValue = Math.max(...values);
let maxHeightBar = 150;
console.log(maxValue);

let bars = document.querySelectorAll('.bars__grafics-chart');
bars = [...bars];

bars.forEach(bar =>{
    let newValue = parseFloat(bar.childNodes[1].innerText);
    let actualHeight = (newValue * maxHeightBar) / maxValue;

// dynamically modifying the height of each bar
    bar.style.height = `${actualHeight}px`;
    if(newValue == maxValue){
        bar.style.backgroundColor =
        'hsl(186, 34%, 60%)';
// making the label appear with the value of each bar when the mouse is passed
    bar.addEventListener('mouseover', event=>{
        if(event.target.className == 'bars__grafics-chart'){
            let labelElement = event.target.childNodes[1];
        labelElement.style.display = 'block';
        }
    });
// making the label disappear with the value of each bar when the mouse leaves
    bar.addEventListener('mouseout', event=>{
        if(event.target.className == 'bars__grafics-chart'){
            let labelElement = event.target.childNodes[1];
        labelElement.style.display = 'none';
        }
    });
})
Author 🙋🏻♂️
- Twitter/X - @agus_firpo
- Frontend Mentor - @Arfirpo
- Linkedin - Agustín Rodrigo Firpo
Community feedback
Please log in to post a comment
Log in with GitHubJoin our Discord community
Join thousands of Frontend Mentor community members taking the challenges, sharing resources, helping each other, and chatting about all things front-end!
Join our Discord
