
Responsive expenses chart component using react,sass and vitejs


Design comparison
Solution retrospective
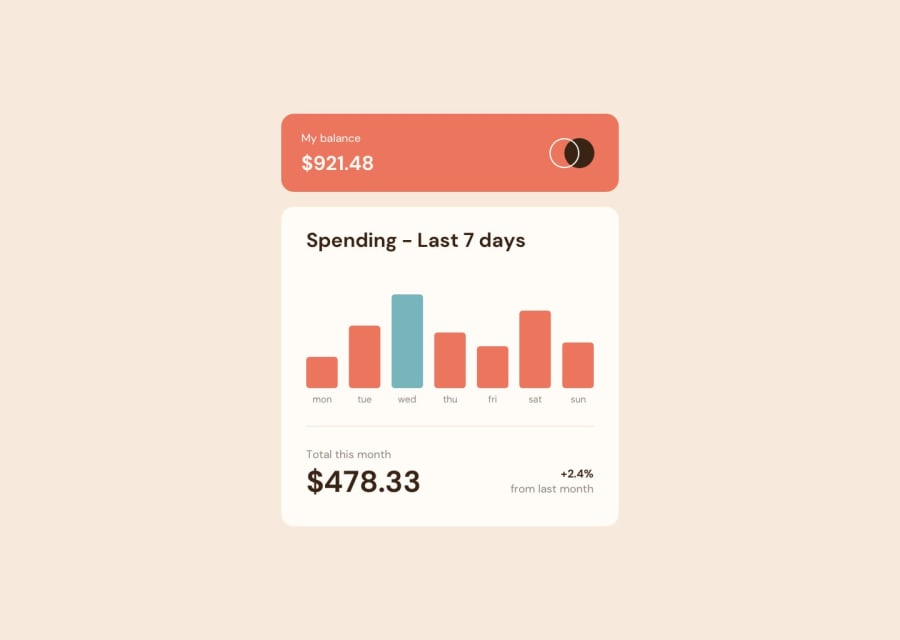
I had a lot of issues implementing the chart bars, as I couldn't properly give them the size required, as well as in the live site the bars are even smaller than on development. Is there a better way to create those bars as to give them a reasonable size? Thank you very much iin advance!
Community feedback
- @mubizzyPosted over 2 years ago
Excellent job on this challenge! your report has a few issues though:
-
wrap everything in your body in
<main>or use semantics -
it is a best practice to use both HTML 5 and ARIA landmarks to ensure all content is contained within a navigational region.
Hope it helps:)...don't forget to mark it as helpful 👍
Marked as helpful0 -
- @FalejevVPosted over 2 years ago
Hi. IDK if my solution is great but i did it using % height.
- Using JS you search a day that has the most money spent, that will be "Top one" with cyan color and it will be 100% of height.
- Then you loop through each day and calulate % difference from the "Top bar". ( For example Top bar is 100$. Is has 100% height. Another bar is 60$, so it will have 60% of height. )
- Pass calulated % as prop to bar "Height". I hope my bad explanation helped :P
Marked as helpful0


Please log in to post a comment
Log in with GitHubJoin our Discord community
Join thousands of Frontend Mentor community members taking the challenges, sharing resources, helping each other, and chatting about all things front-end!
Join our Discord