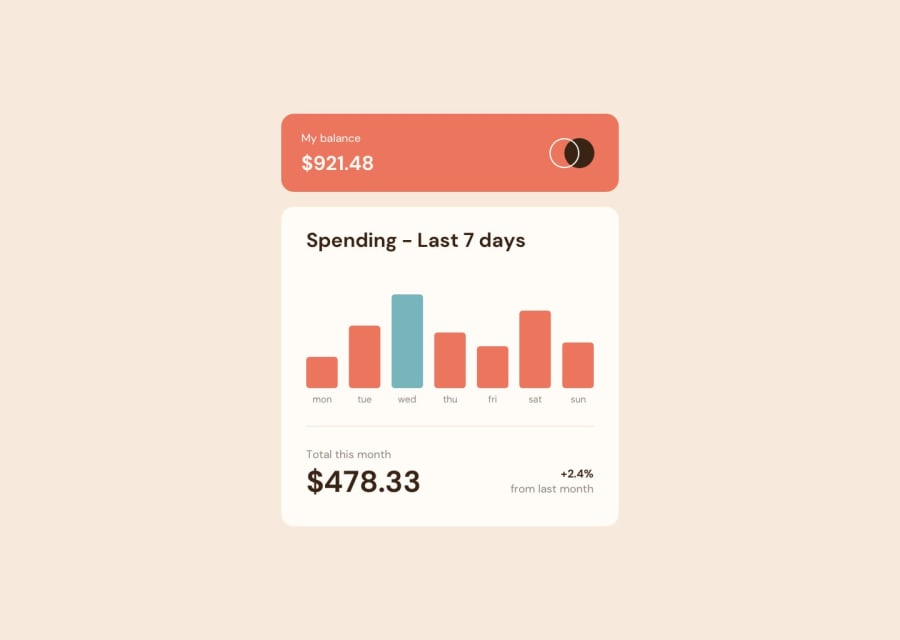
Design comparison
SolutionDesign
Solution retrospective
Hey, there!
I just completed this challenge. That was lots of fun! After playing around a little bit, it didn't take me long to figure out how to implement a dynamic chart. And, here's the approach I went with:
- Find the highest value in the data array
- Divide the remaining values by the highest value
- Multiply the result by 100 to get the percentage
- Use the percentage to set the height of the bar
In other words, if the highest value is 50, and we want to find the height of 20:
20 / 50 => 0.4 * 100 => 40%
I would be more than happy to know about your approach and how you implemented. Also, if you have any suggestions or find any bugs, please do let me know! I'll always look forward to learning new things.
Community feedback
Please log in to post a comment
Log in with GitHubJoin our Discord community
Join thousands of Frontend Mentor community members taking the challenges, sharing resources, helping each other, and chatting about all things front-end!
Join our Discord
