


Design comparison
Solution retrospective
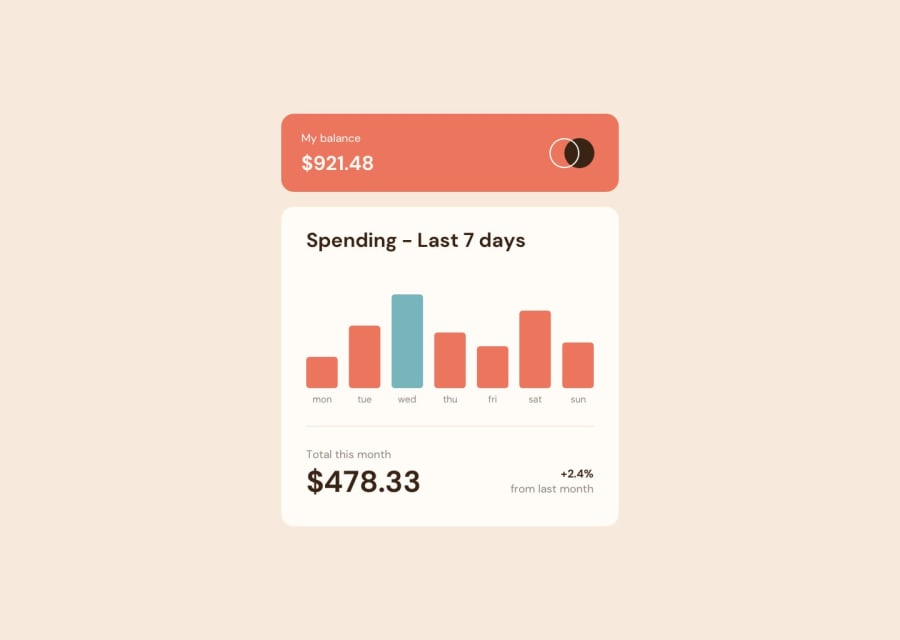
The challenge in this component is, how to transform the values of the JSON data to a shape and background color, and how in case of a change occurred in the data, the bars change also accordingly. The challenge was a great opportunity for me to get a deep understanding of some notions in React js especially the hooks, the event in javascript.
the use of useEffect enabled me to put the background for all the bars taking into consideration the bar with the maximum amount, also the use of the style inline for the height enabled me to draw the shape of the bar.
Community feedback
- @neilk17Posted about 2 years ago
Dear Abdelouahed, congrats on this challenge!
I also just completed this one so I know it wasn't that easy.
Here's some suggestions if you don't mind:
- Accessibility : These are simple fixes. You need to replace the main <div> tags with html landmarks such as header, footer, main.
- Clicking on the bars : Good work with displaying the values above the bars chart since that is something I wasn't able to achieve.
- Bottom section: I know it was difficult to space these parts of the page, you can take a look at my solution for some suggestions on how I styled them.
Good luck for future challenges!
0@ab77-ossPosted about 2 years ago@neilk17 Hi Neil, Thank you so much for your feedback your remarks are so helpful, especially accessibility remark; Related to your solution, your design is great, the js part, just try to begin and you find yourself in face with the solution, if you need any explanation in mine, I'm ready for help; Good luck
1@neilk17Posted about 2 years ago@ab77-oss Thanks! I will take a look at your code, since I need some help with the js section, I saw that you used chart.js library. I'll look into that.
0

Please log in to post a comment
Log in with GitHubJoin our Discord community
Join thousands of Frontend Mentor community members taking the challenges, sharing resources, helping each other, and chatting about all things front-end!
Join our Discord