Submitted over 3 years agoA solution to the Expenses chart component challenge
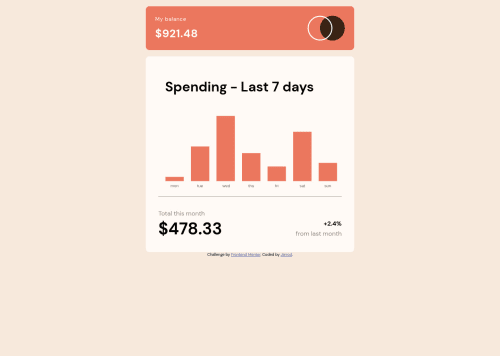
Expenses-Chart

@cannonjarrod19
Solution retrospective
I used Chart.js and had difficulty getting function to border-radius of bars in the chart as well as updating tooltip info upon hover. Feedback welcome on any improvements as I'm early on self-taught and trying to improve skills.
Code
Loading...
Please log in to post a comment
Log in with GitHubCommunity feedback
No feedback yet. Be the first to give feedback on Jarrod's solution.
Join our Discord community
Join thousands of Frontend Mentor community members taking the challenges, sharing resources, helping each other, and chatting about all things front-end!
Join our Discord