Submitted about 1 year ago
Expenses Component | Next.js, TypeScript, Tailwind & Chart.js
@adamrichardturner
Design comparison
SolutionDesign
Solution retrospective
Overview
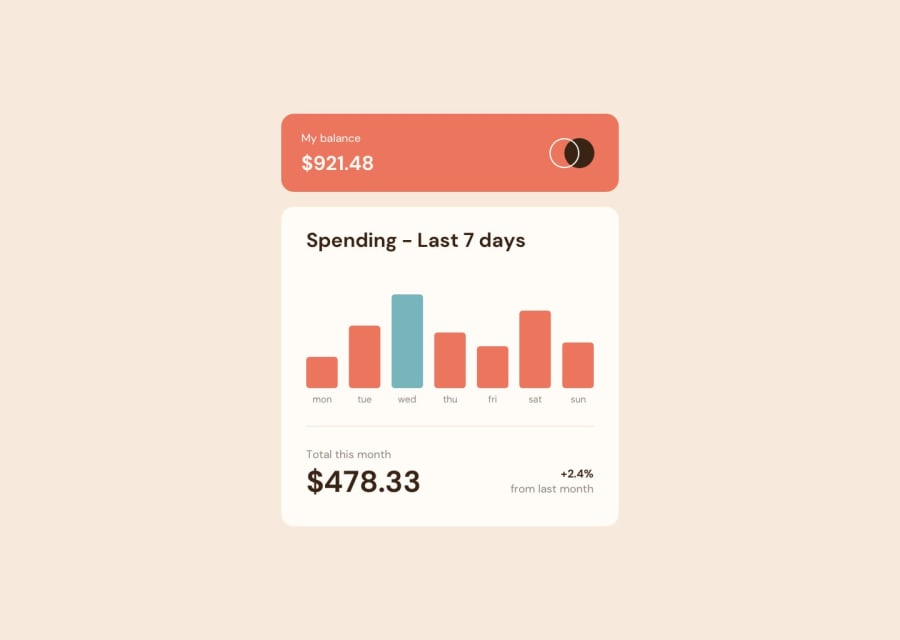
In this Next.js, TypeScript and Tailwind app, I dynamically present JSON chart data using Chart.js.
Bars are represented by the amount of spending, and the current day as per the user's locale is highlighted with a different colour bar.
The challenge
Users should be able to:
- View the bar chart and hover over the individual bars to see the correct amounts for each day
- See the current day’s bar highlighted in a different colour to the other bars
- View the optimal layout for the content depending on their device’s screen size
- See hover states for all interactive elements on the page
- Use the JSON data file provided to dynamically size the bars on the chart
Screenshot Preview

Links
- Live Site URL: https://expenses-chart-nu.vercel.app/
Built with
- React - JS library
- Next.js - React framework
- Tailwind CSS - For styles
- TypeScript - Programming Language
- Chart.js - Package for building dynamic charts
Community feedback
Please log in to post a comment
Log in with GitHubJoin our Discord community
Join thousands of Frontend Mentor community members taking the challenges, sharing resources, helping each other, and chatting about all things front-end!
Join our Discord
