
Submitted over 1 year ago
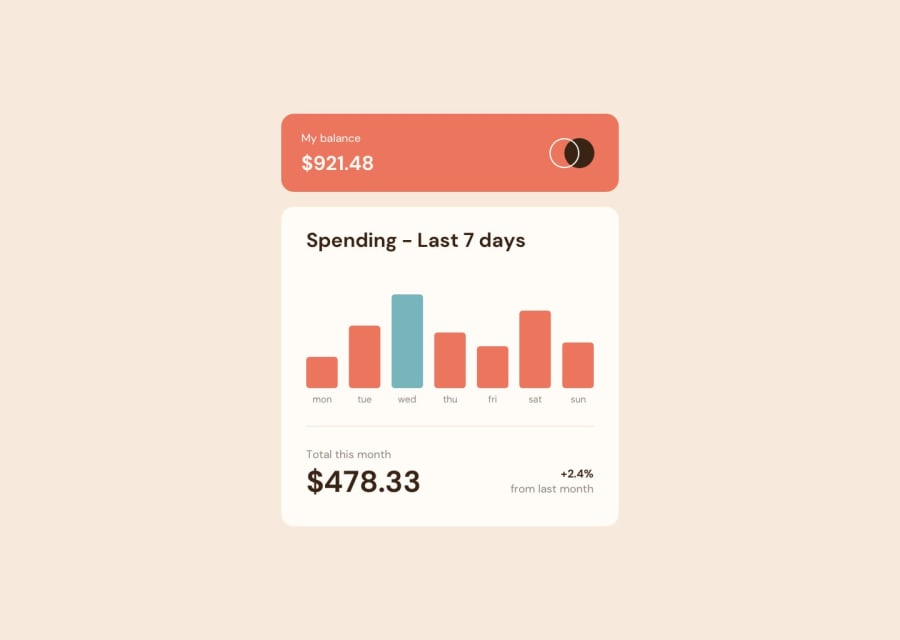
Expenses Chart using Svelte, TS, Chart.js, and Tailwind

@fredcamp

Design comparison
SolutionDesign
Solution retrospective
To integrate Chart.js with Svelte, you have to make sure you imported the correct path when using Chart.js with npm.
import { Chart, type ChartItem } from 'chart.js/auto'
Since the chartCanvas would return undefined when the component is rendered, we have to use Svelte's onMount() to make sure that the chart would be displayed after the component is rendered.
import { onMount } from 'svelte'

let ctx: ChartItem
let chartCanvas: HTMLCanvasElement
let myChart: Chart

onMount(() => {
  displayChart()

  return () => {
    myChart.destroy()
  }
})

function displayChart(): void {
  //chart initialization goes here.....
}
<canvas class="cursor-pointer" bind:this={chartCanvas} />
Community feedback
Please log in to post a comment
Log in with GitHubJoin our Discord community
Join thousands of Frontend Mentor community members taking the challenges, sharing resources, helping each other, and chatting about all things front-end!
Join our Discord