


Design comparison
SolutionDesign
Solution retrospective
What are you most proud of, and what would you do differently next time?
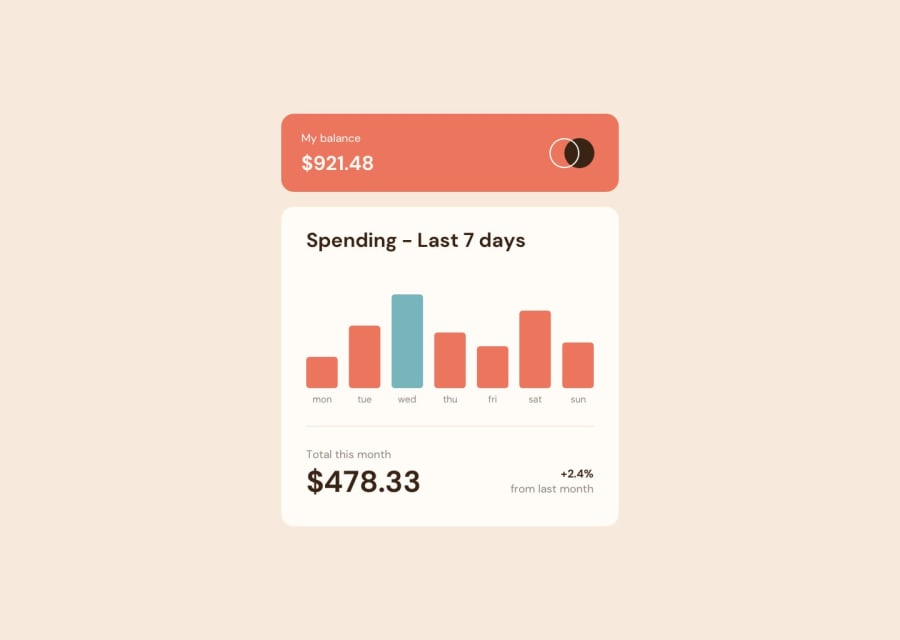
I wanted to apply what I read on d3.js for data visualization on a simple project. So this challenge helped me learn the basics.
What challenges did you encounter, and how did you overcome them?- It was my first time deploying a vanilla html + css + js on Vercel, and it didn't go smoothly. It took me awhile to get it working. It was mostly due to my lack of understanding of the basics, especially how to serve static files directly.
- Styling and placing stuff on the
svgby hand + adding interactiveness with d3.js was not fun.
Community feedback
Please log in to post a comment
Log in with GitHubJoin our Discord community
Join thousands of Frontend Mentor community members taking the challenges, sharing resources, helping each other, and chatting about all things front-end!
Join our Discord