Design comparison
SolutionDesign
Solution retrospective
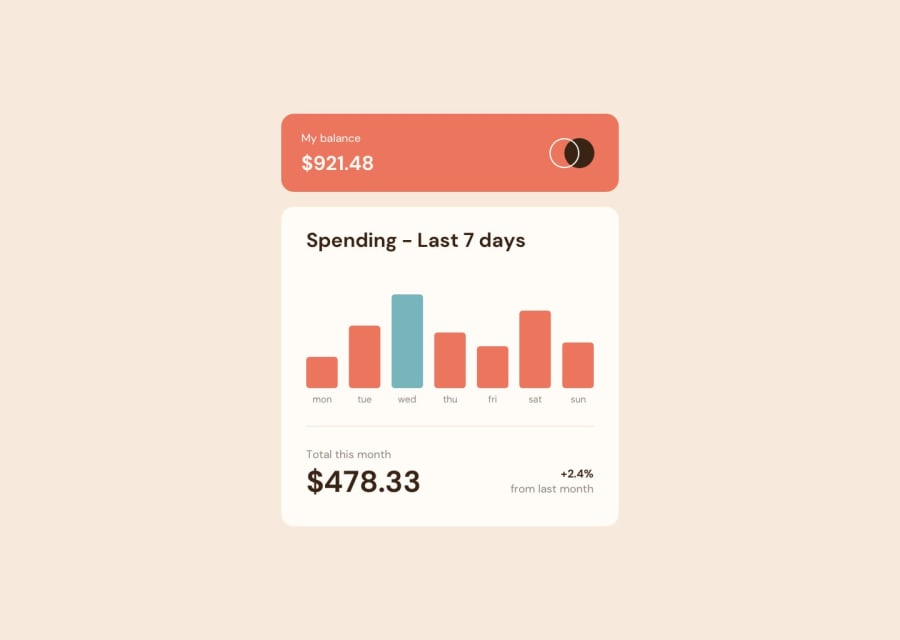
This is my first attempt at making a chart using dynamic content. I found customising the graph quite a challenge. Not as easy as just using vanilla CSS. I altered some of the content as i thought it made more sense given what's on screen. The total at the bottom is for the duration of the week only and is calculated using the amounts for each day in the week. The current day is continually updated according to what day it is currently. Would appreciate some feedback on my code as I'm fairly new to React
Community feedback
- @Mahi5902Posted over 1 year ago
HELLO ,I AM NEW HERE ,HOW TO USE THIS PLATFORM HOW TO SUBMIT CHALLENGES ?
0
Please log in to post a comment
Log in with GitHubJoin our Discord community
Join thousands of Frontend Mentor community members taking the challenges, sharing resources, helping each other, and chatting about all things front-end!
Join our Discord
