


Design comparison

Solution retrospective
What are you most proud of, and what would you do differently next time?
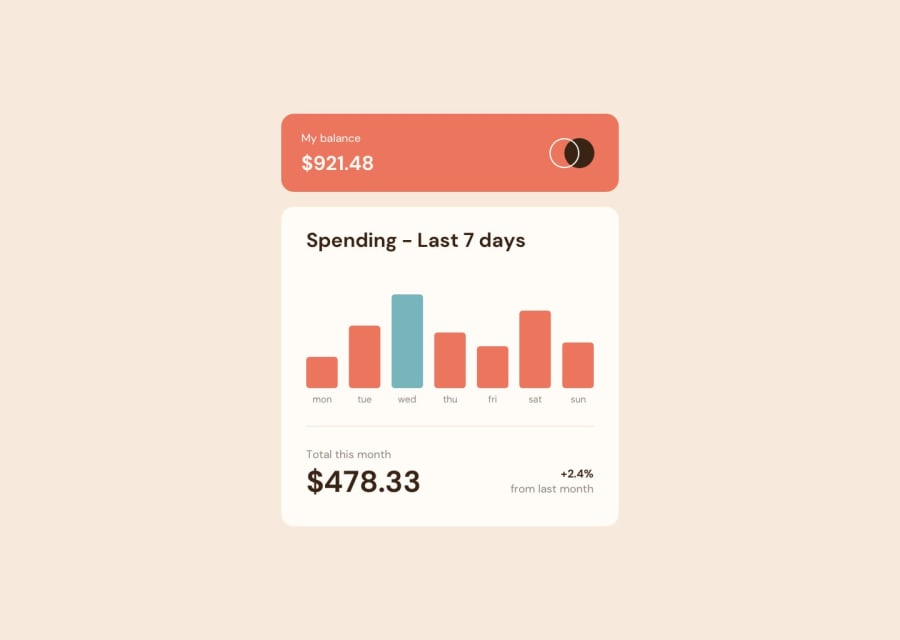
Hi here is my solution for Expenses-chart-component. I used HTML, CSS and JS.
What challenges did you encounter, and how did you overcome them?
The challenge was to extract data from JSON file and display it in the graph when you go over with the pointer.
What specific areas of your project would you like help with?
I did some research on the net and trying to remember that I learned.
Here is my solution to fetch the data then use it to set height, amount.
And display a different color for the day of the week :
fetch('./data.json')
                .then(res => res.json())
                .then((file) => {
                    for(data of file)
                    {
                        day[i].innerText = `$${data.amount}`;
                        week[i].style.height = `${data.amount/5}rem`
                        week[whatDay].style.backgroundColor = 'hsl(186, 34%, 60%)';
                        i++;
                    }
                });
If you mind telling how I can improve my code, it's working as I like but a better solution for JS.
Community feedback
Please log in to post a comment
Log in with GitHub
Join our Discord community
Join thousands of Frontend Mentor community members taking the challenges, sharing resources, helping each other, and chatting about all things front-end!
Join our Discord