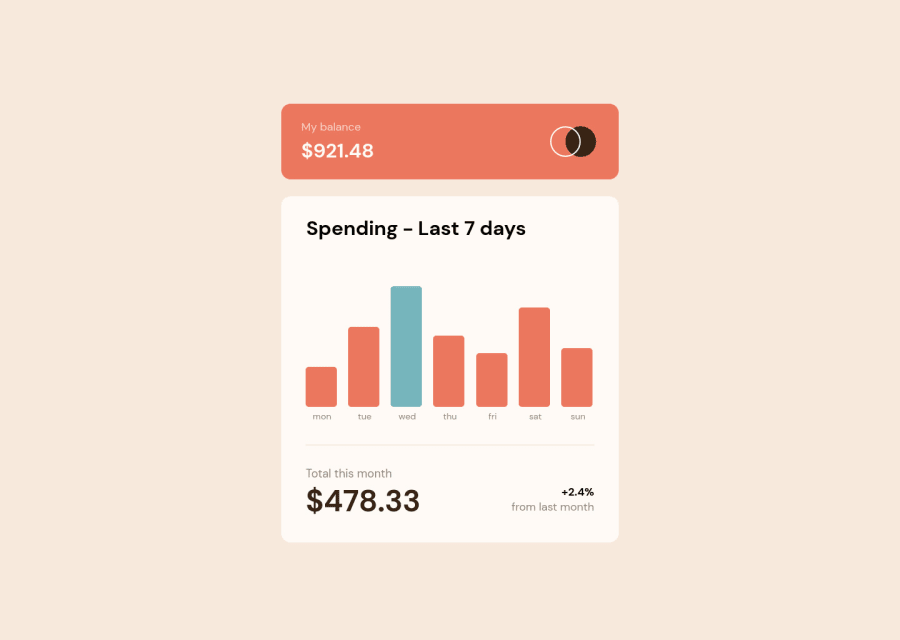


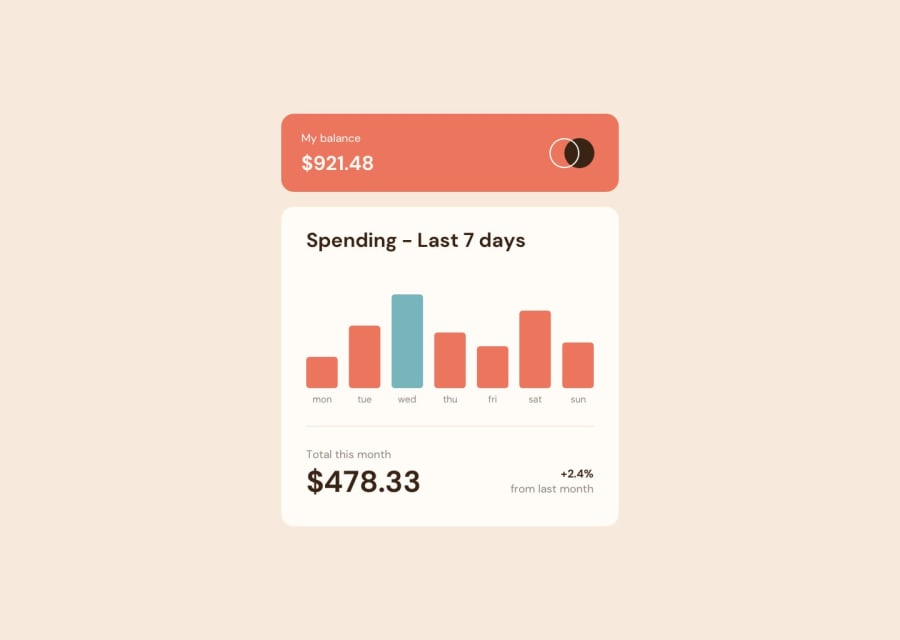
Design comparison
Solution retrospective
Hi, Frontend Mentor community! 👋
For this challenge, I struggled to figure out how to read the local JSON file provided with vanilla JS. If you have a cool trick for this, I'm happy to hear that!
Happy coding! ☕️
Community feedback
- @sylverdragPosted over 2 years ago
Looks good, but there are couple issues:
- The bar highlighted doesn't match the current day. You can fix it with something like this:
function highlight_day(){ const d = new Date(); let day = d.getDay(); let bar = ".bar:nth-child("+day+")"; $(bar).css("background", "hsl(186, 34%, 60%)"); }- The barHeight can be too high depending on the data. For instance, if the client spends $900, your code would set the barHeight at 1350% which would of course not fit in the widget. You can fix that by finding the biggest amount and working out the proportion so that all bars will fit in the space.
For instance:
 var fraction = maxAmount / 100;
 let barHeight = stat.amount /fraction;
 bar.style.height = barHeight + "%";
Marked as helpful1@TSune-webPosted over 2 years agoHi, @sylverdrag, thank you for the advice!
For the first issue, I can't find any issues. I compared the data, the provided local JSON file, with the display and hover effects, and they seem to be working fine. I tested on both Chrom and Firefox and they displayed the data correctly.
I appreciate that you've made a good point about the second issue! I have fixed it so it won't show any excess percentage👍
Your examples really helped. Thank you!
Happy coding! ☕️
0@sylverdragPosted over 2 years ago@TSune-web Cool!
For #1, the brief says: Your users should be able to:
- [...]
- See the current day's bar highlighted in a different colour to the other bars
Your widget always highlights Wednesday, which is the day in the picture, but not the current day. Today is Monday, but it still shows Wednesday.
Also, it highlights it because the value is higher than 100, not because of which day it is.
It makes sense because you are trying to match the picture in the challenge and it's one of the easiest way to do so, but if you think in terms of a working widget, you have a problem: suppose the user spends more than "100" several times in a week. Now all those days are highlighted. And if he spends less, there is no highlight at all.
So your widget looks perfect, but some of the functionality is missing.
1@TSune-webPosted over 2 years agoHi, @sylverdrag, thanks for the critical advice!!
I have added the functionalities you pointed out so the application should display the right percentage of spending and highlight the bar based on the current day.
Let me know if there's any functionality missing!👋
0

Please log in to post a comment
Log in with GitHubJoin our Discord community
Join thousands of Frontend Mentor community members taking the challenges, sharing resources, helping each other, and chatting about all things front-end!
Join our Discord