Submitted over 2 years ago
Expenses Chart Component with chart.js
#accessibility#sass/scss#chart-js

@kxnzx

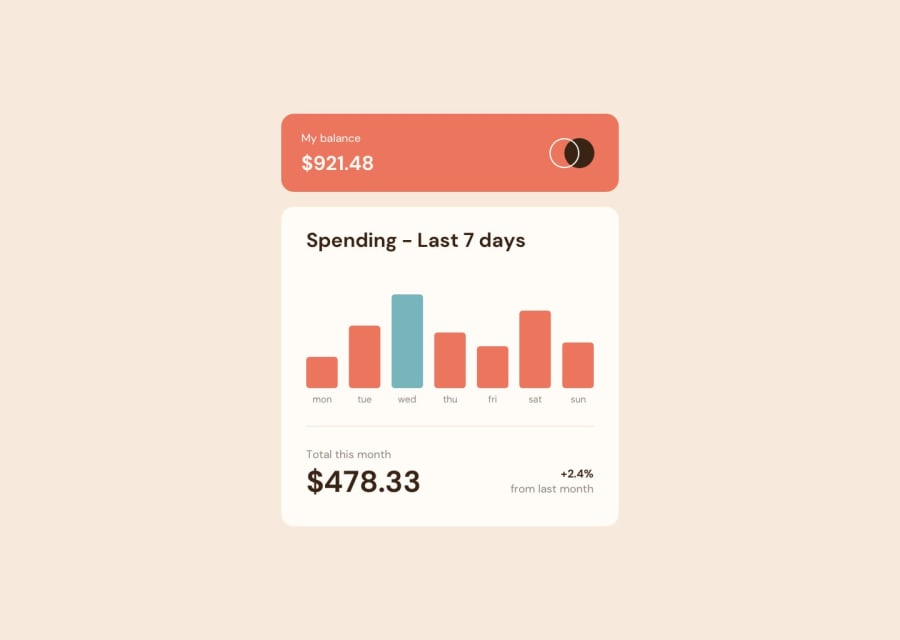
Design comparison
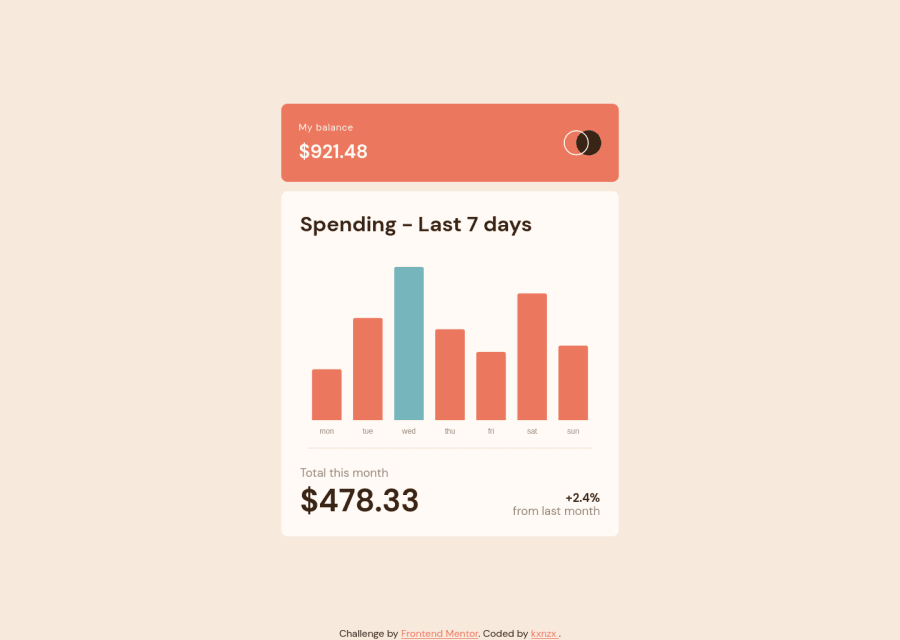
SolutionDesign
Solution retrospective
What I learned:
Working on this solution was a great way for me to learn more about JavaScript. I created the vertical bar graph with Chart.js and customized the chart in JavaScript. I placed the chart in a canvas tag in HTML:
<canvas id="chart" width="300" height="200"> </canvas>
I also learned a bit about Data Types:
- Strings: "Hello World" "Total:" "A"
- Numbers: 10 1.5 -30 1.2e10
- Boolean: true false
- null: null These are combinations of the above:
- Arrays [1,2,3] ["Hello","World"]
- Objects { "key":"value" } { "age": 30 }
Community feedback
Please log in to post a comment
Log in with GitHubJoin our Discord community
Join thousands of Frontend Mentor community members taking the challenges, sharing resources, helping each other, and chatting about all things front-end!
Join our Discord