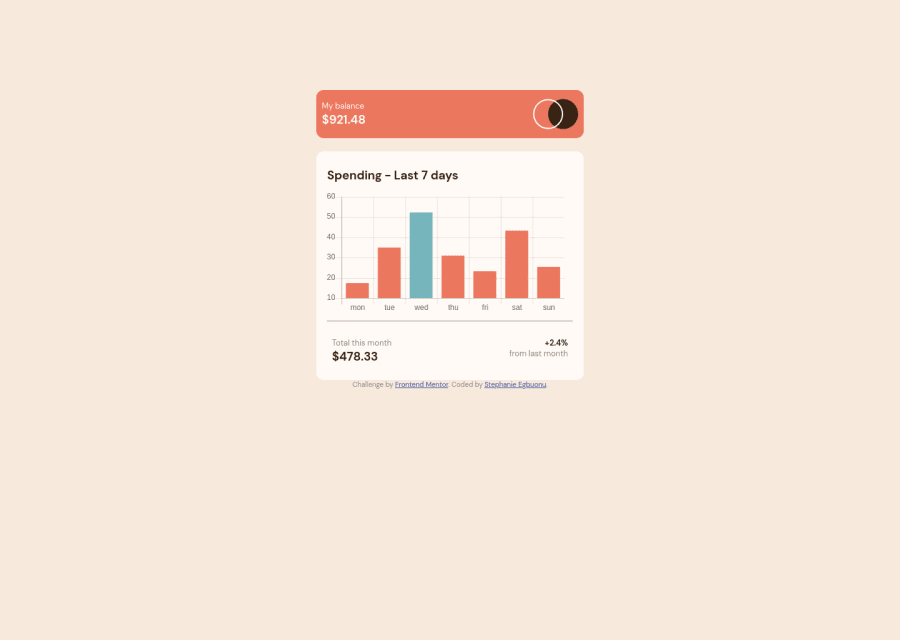
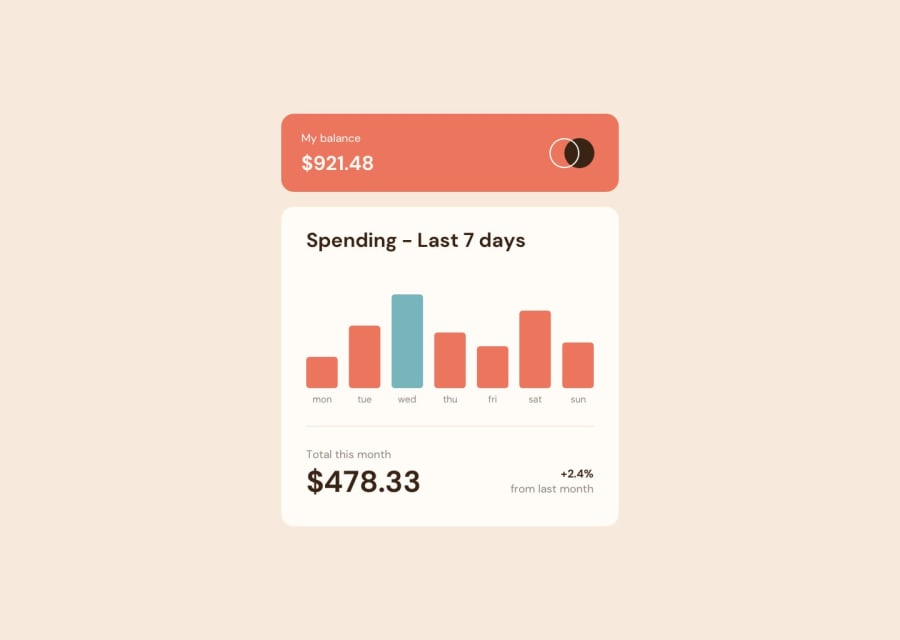
expenses chart component main using HTML CSS and JavaScript


Design comparison
Solution retrospective
This is definitely not the best I can do so every feedback will be be appreciated! how do i make the chart look exactly like the template while still making it dynamic?
Community feedback
- @jgreen721Posted over 2 years ago
I think rather than using the chart.js library, you can just map thru the data and create a new div element to act as your bar and create its height based upon the amount value and then just append that onto the page.
So something like
data.forEach((day) => { var chartDiv = document.createElement("div"); chartDiv.className = "chart-div"; chartDiv.style.height = day.amount * 2 + "px"; document.querySelector(".yourchart").append(chartDiv); })Again, just an example...that appears to print out really awkward, grrr, lol but text editor should be able to clean it up.
Nice work though. It all looks good and there certainly no harm in getting some practice in with the chart lib!
Marked as helpful0@stephanniegbPosted over 2 years ago@jgreen721 thanks I'll definitely try it out
0

Please log in to post a comment
Log in with GitHubJoin our Discord community
Join thousands of Frontend Mentor community members taking the challenges, sharing resources, helping each other, and chatting about all things front-end!
Join our Discord