Expenses Chart Component challenge using JavaScript and SASS
Design comparison
Solution retrospective
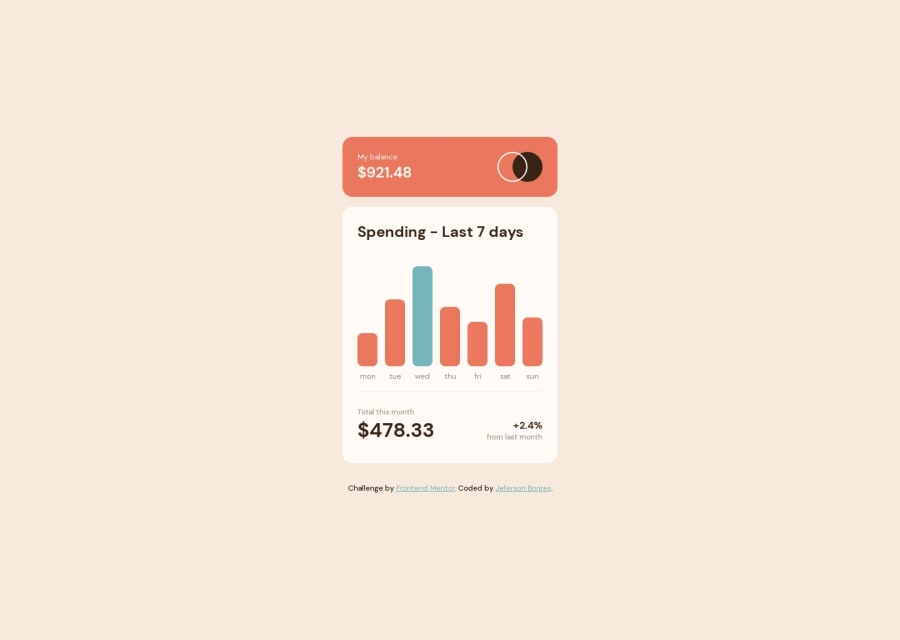
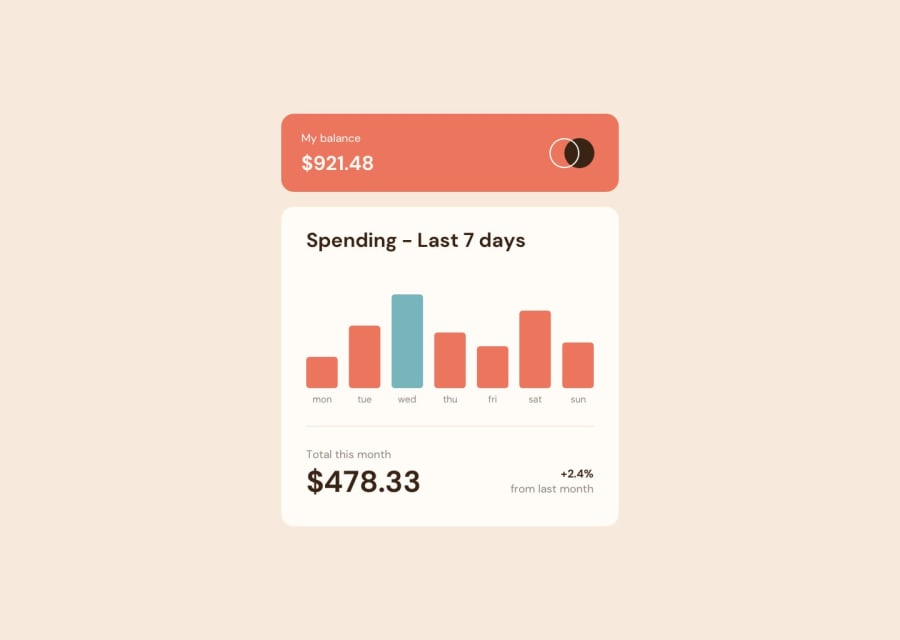
I'm thrilled to share my solution for the Expenses Chart Component challenge by Frontend Mentor. I developed this dynamic web application using HTML, CSS/SASS, and JavaScript.
The challenge required creating an interactive chart that visualizes expenses over the last 7 days. Users can hover over the bars to view the exact amounts spent each day. The application has a responsive design and offers a seamless user experience across different devices.
I employed modern web development techniques, including DOM manipulation, asynchronous programming with the Fetch API, and object-oriented programming. The codebase is clean, well-structured, and follows best practices to ensure maintainability and scalability.
Community feedback
Please log in to post a comment
Log in with GitHubJoin our Discord community
Join thousands of Frontend Mentor community members taking the challenges, sharing resources, helping each other, and chatting about all things front-end!
Join our Discord
