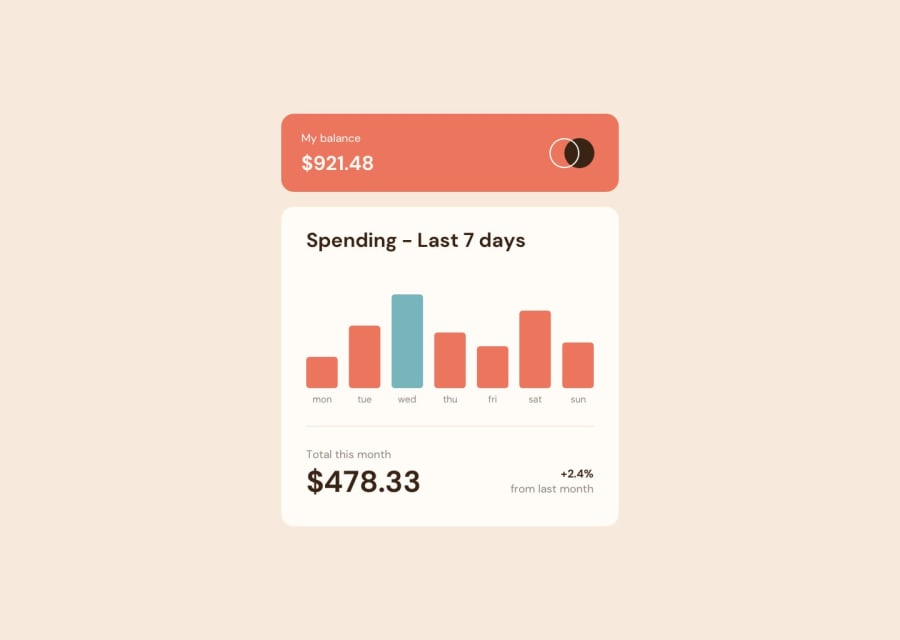
Expenses chart component | BEM, SASS, Vanilla JS
Design comparison
Solution retrospective
Hi! I wanted to do this challenge to practice working with JSON archives, I learned a lot from this, even though it is relatively simple looking. Every value of the chart is being pulled from the JSON file so I think I did accomplish the bonus tip of the challenge? I'm not sure if See dynamically generated bars means an animation of the bars rising or it means that the chart changes based on the values of the JSON (That's what I did), anyway, I'm happy with what I did!
PD: Tomorrow we wil see if the current day bar changes like it's supposed to do
PD2: Yes it does
Community feedback
- @AdamMzkrPosted over 2 years ago
Hi GREAT job! nice looking smooth and nice animation. Only some HTML issues to fix :)
1@KTrick01Posted over 2 years ago@AdamMzkr Hi! Thank you! The "errors" that the report detected were a needed part of the code, but I found a way to "hide" them from the report, so you helped me more than you thought, thanks!
0
Please log in to post a comment
Log in with GitHubJoin our Discord community
Join thousands of Frontend Mentor community members taking the challenges, sharing resources, helping each other, and chatting about all things front-end!
Join our Discord
