Expenses chart component

Solution retrospective
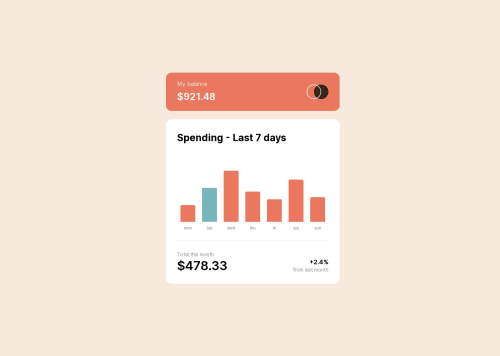
In this application, which is built with Next.js, TypeScript, and Tailwind CSS
The bar chart visualizes spending levels, with a uniquely coloured bar indicating the present day, as determined by the user's local settings.
Users have the capability to:
Examine the bar chart and mouse over individual bars to display precise spending figures for each date. Distinguish the bar that represents the current day by its distinctive color. Experience a responsive design that adjusts the content layout for optimal viewing on their specific device screen. Interact with the page elements that display visual feedback when hovered over. Utilize the supplied JSON data file to automatically adjust the bar sizes on the chart based on the data.
Note: I did have issues compiling on Vercel but that was my fault for not compiling locally first. Once I did that, I could upload to Vercel
Please log in to post a comment
Log in with GitHubCommunity feedback
No feedback yet. Be the first to give feedback on Dev Killian's solution.
Join our Discord community
Join thousands of Frontend Mentor community members taking the challenges, sharing resources, helping each other, and chatting about all things front-end!
Join our Discord