Design comparison
Solution retrospective
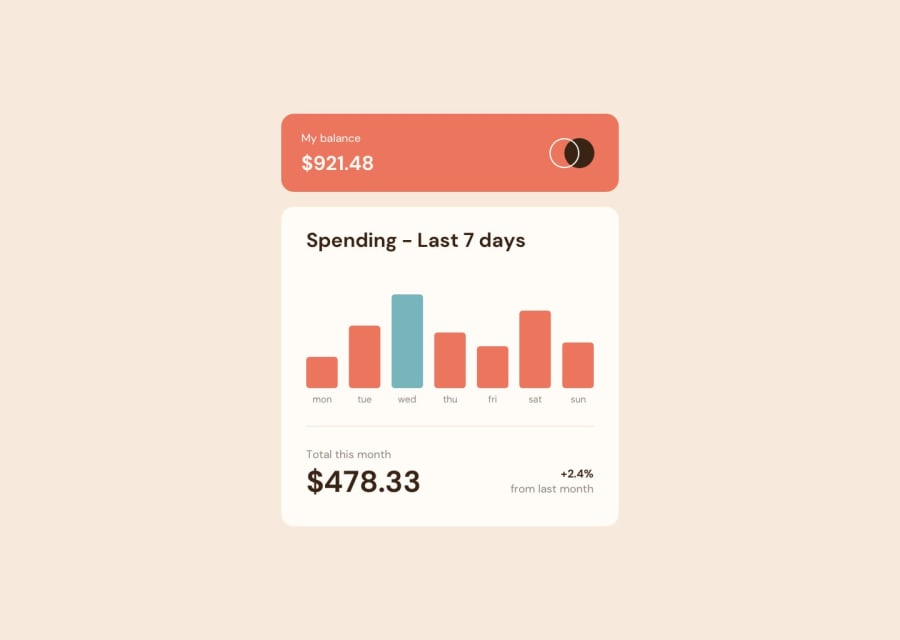
Chart is done using canvas, was harder to do than i expected, but it is working, even though it is a bit messy.
Community feedback
- @Cats-n-coffeePosted almost 2 years ago
Hi Kamil!
Your solution looks good but I can't see the chart (using FF)! There is an error in the console
this.data is undefinedwhich shows the stack trace fromgenerateBars. I'm not sure if it's becausethis.datais inside an async function and the result needs to be awaited when using it (or run the next step inside the.then()). I wonder if theloadevent is finished before you get the result of theloadDatafunction since they seem to run in "parallel"? Your code looks clean, would love to see this canvas work!1@GlaDdosPosted almost 2 years ago@Cats-n-coffee There was indeed a problem with async call, thanks for pointing that out :) Also FF isn't supporting canvas roundRect function, so i had to work around that. Should be working now. Appreciate your input!
0@Cats-n-coffeePosted almost 2 years ago@GlaDdos Super cool doing this with the Canvas Api! Tooltip and bars look good! The labels seem to not have picked up the font, I wonder if you need to use
FontFacelike they're saying here https://stackoverflow.com/questions/40199805/unable-to-use-a-google-font-on-canvas? I can't remember the dataset (I did this challenge a while ago), Monday doesn't have a tooltip but I don't know if there is data for that day? Even if there isn't, try to always have a message for the user for consistency. The tooltip gets stuck sometimes if you hover and leave the canvas right away (try it on Sunday, mouseout to the right), not sure what's causing this but it looks like an "area" and event related thing. Maybe the Sunday bar is too close to the edge of the canvas?Awesome work!
1@GlaDdosPosted almost 2 years ago@Cats-n-coffee I don't think you need to use FontFace if you are using font that is already loaded. I was missing quotes - font name was more than one word and it wasn't displaying properly because of that , thanks for catching that :) All bars should have a tooltip, don't know why it wasn't displaying for you, but while i was checking that i changed the way height is calculated and it should now better reflect value to height ratio and fixed issue where big differences in value caused issues with chart height. Tooltip is getting stuck if cursor is moving too fast and event is not detecting if it have left orange bar area. It is kind of design choice, because i chose to redraw only when cursor is entering or leaving orange bar area and not on every mousemove event. I've added a small margin of empty canvas on both sides of chart so it sould be a little less prone to it.
Thanks again for your feedback :)
0
Please log in to post a comment
Log in with GitHubJoin our Discord community
Join thousands of Frontend Mentor community members taking the challenges, sharing resources, helping each other, and chatting about all things front-end!
Join our Discord
