
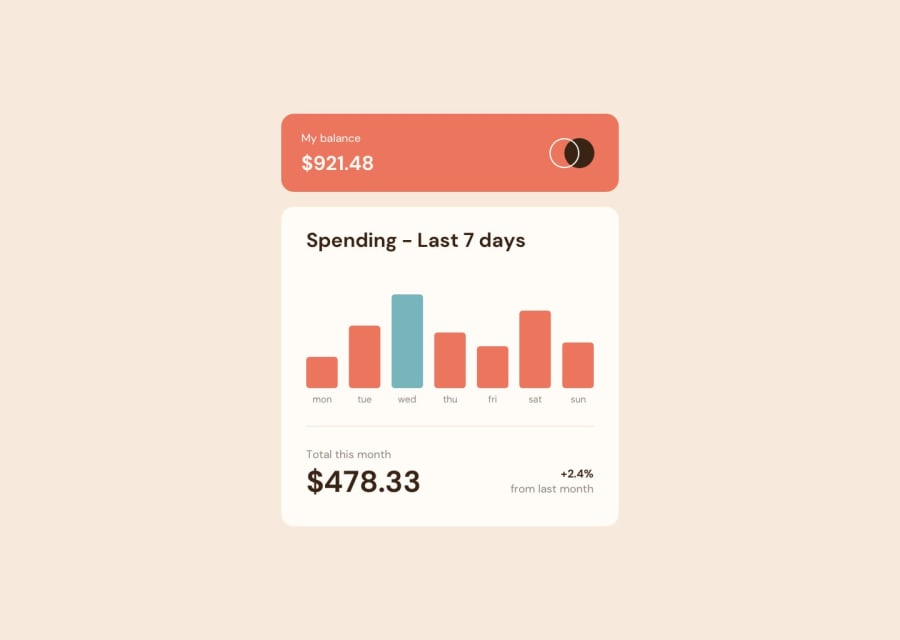
Expenses Chart Component using Vue, Chart JS, Pug & SCSS


Design comparison
Solution retrospective
Hello everyone! It's my first time using Vue and ChartJS. My solution is obviously far from the initial design. So, here's my questions:
- First of all, I didn't quite figure out how to round the borders at the bottom of my each column. When I set it to "borderRadius: 10", ChartJS only rounds the top corners;
- Second, I didn't find any information how to hide separators between columns;
- And lastly, when you hover any column, you are able to see digits without dollar sign.
If anyone knows how to fix these problems, please write down in the comments section.
Thanks in advance!
Community feedback
- @festsnusaPosted almost 2 years ago
Hello everyone! It's my first time using Vue and ChartJS. So, it's quite obvious that my solution is far from the initial design. I have a few questions to the community:
- First of all, as you can see, the bottom corners of columns are not rounded. I used borderRadius: 10, but ChartJS only rounds the top corners;
- Second, I didn't find any information to how to hide the separators between the columns;
- Lastly, if you hover any column, it shows digits without the dollar sign.
If anyone knows how to fix these problems, please be sure to leave the comment.
Thanks in advance!
0@KitketovskyPosted almost 2 years ago@festsnusa hey, I haven't used ChartsJS library, but Recharts in React, but I don't think they are totally different. There might be an option in ChartJS API to assign a custom classname to your columns, do that and in CSS you need to write border radius of your choice to overwrite what ChartJS assigns. I think the library cuts the borders at the bottom, because usually you don't see them quite often, they are usually cut. If there's no option to assign your columns with a classname, you can inspect the graphs in your browser, find any column and what its classname is. After that, in wrapper you can write your rule for borders and thah should be it.
About the dollar sign. There also should be API for changing what your tooltip can show. Usually it's a function with initial argument that returns a string. So you need return that value of the graph plus the dollar sign.
0

Please log in to post a comment
Log in with GitHubJoin our Discord community
Join thousands of Frontend Mentor community members taking the challenges, sharing resources, helping each other, and chatting about all things front-end!
Join our Discord