


Design comparison
Solution retrospective
This challenge took me a while because I don't know much about async / await functions, I don't feel good about my knowledge in this kind of functions so if you know where can I learn or read more about this I would really appreciate it if you share it with me. Any feedback is welcome!
Community feedback
- @DreamCoder7Posted over 2 years ago
Hey, BreinerJT👋
Nice effort on this challenge!👏
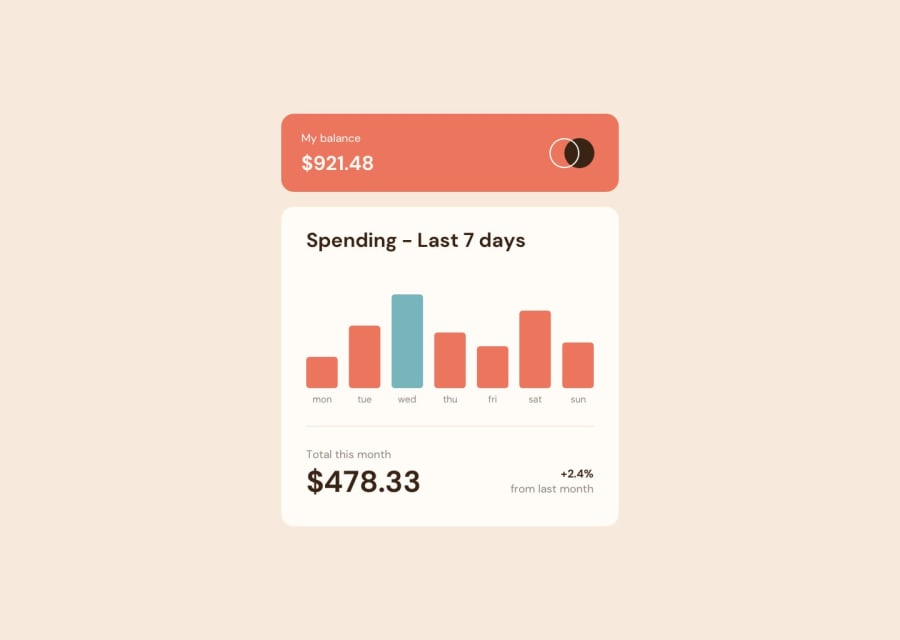
Overall, your solution looks great! One small thing I'd like suggest is that instead of outputting the chart data one by one using html like you did, you can dynamically output from JavaScript. Also you can add a Gaurd clause incase if the user failed to load, More about Gaurd clause
async function getData(url){
    let fetchData = fetch(url)
    let response = await fetchData;
// Adding Gaurd clause
    if (!response.ok) return;
    let data = await response.json()
    return data;
}

 async function getCharts(){
    const chart = document.querySelector(".charts");
    const data = await getData('data.json');

    let html = null;
    data.forEach(e => {
       html =  `
        <div class="chart-container">
            <p class="day" data-id="mon">${e.day}</p>
            <div class="js-chart chart" id="mon" style="height: ${e.amount}%"></div>
            <label class="js-label" for="mon">${e.amount}</label>
        </div>
        `
    chart.insertAdjacentHTML("afterbegin", html);
    });

// Not needed
/*
    const amounts = data.map(e => e.amount)
    let maxValue = Math.max(...amounts)
    let heights = amounts.map(e => e / maxValue * 100)
    charts.forEach((value, index) => {
        value.style.height = `${heights[index]}%`
    })
    charts[day].classList.add("current-day")
    labels.forEach((value, index) => {
        value.textContent = `$${amounts[index]}`
     })
*/
}

getCharts()
Hope that helps!🤗
Happy coding.😎
Marked as helpful0@BreinerJTPosted over 2 years agoHi redstorm-hub, I was thinking about adding the chart output from Javascript but I didn't find a good way to do it, thanks for showing me this one.
0 - @DimiPavlovPosted over 2 years ago
Hello BreinerJT and congratulations on completing the challenge.
I really like your idea of switching the colors of the charts, looks very cool. Just a small suggestion for a better user experience is maybe to add 'cursor: pointer' for the hover effect.
Marked as helpful0@BreinerJTPosted over 2 years agoHello DimiPavlov, I don't like the idea of using pointer on any elements beside links you can read more about this here
0


Please log in to post a comment
Log in with GitHubJoin our Discord community
Join thousands of Frontend Mentor community members taking the challenges, sharing resources, helping each other, and chatting about all things front-end!
Join our Discord