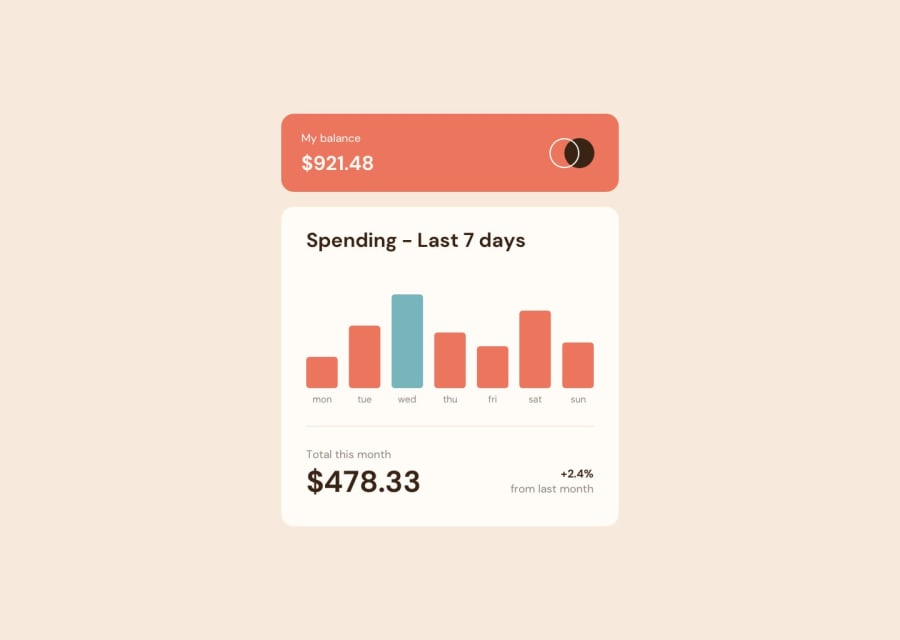
Design comparison
SolutionDesign
Solution retrospective
Feedback is welcome. Any one have idea how to hide the border of x-axis & y-axis ? I have tried and searched many methods but all does not work :( Thanks in advance.
Community feedback
- @Youssif94Posted almost 2 years ago
Under the 'scales' > x or y > grid. you need to add "drawTicks" and set it to false
just under your 'drawOnChartArea'
            scales: {
                x:{
                    grid: {
                    drawOnChartArea: false,
                    drawTicks:false,
                    },

               },
               y: {
                grid: {
                    drawOnChartArea: false,
                    drawTicks:false,
                },
                ticks:{
                    display: false
                }
               }
            }
Marked as helpful0
Please log in to post a comment
Log in with GitHubJoin our Discord community
Join thousands of Frontend Mentor community members taking the challenges, sharing resources, helping each other, and chatting about all things front-end!
Join our Discord
