Expense Chart - using Shadcn Chart

Solution retrospective
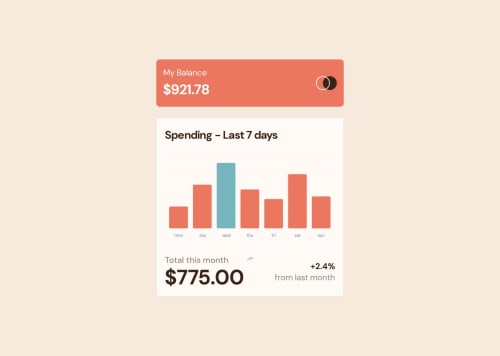
My focus on this project was to experient with a chart library for data presentation in a diagram form. After some few research I settled to use the Chart component from Shadcn. The library was easy to use as it has a step by step guide on how to set various projects include a setup for React projects created through Vite. The tutorial includes also a complete setup for tailwindcss which I used for styling the project
What challenges did you encounter, and how did you overcome them?Some of the changes that I had to fix was in regards to the amount that has to be displayed when a user hovered over a bar. The amounts in my data represents a number and yet the hovered details should represent the amount with the currency sign. My work around was to create a CustomToolTip as follows
import React from "react";
import { TooltipProps } from "recharts";

// eslint-disable-next-line @typescript-eslint/no-explicit-any
const CustomTooltip: React.FC> = ({
    active,
    payload,
}) => {
    if (active && payload && payload.length) {
        return (

                {`${
                    payload[0].name
                } : $${payload[0].value.toFixed(2)}`}

        );
    }
    return null;
};

export default CustomTooltip;
- The CustomTooltip component checks if the tooltip is active and if there is payload data.
- It formats the amount with a dollar sign and two decimal places using toFixed(2).
The CustomTooltip is then imported in the main file as follows
import CustomTooltip from "./components/customToolTip";
                                 value.slice(0, 3)}
                                />
                                } />
                                } />
Please log in to post a comment
Log in with GitHubCommunity feedback
No feedback yet. Be the first to give feedback on Chamu's solution.
Join our Discord community
Join thousands of Frontend Mentor community members taking the challenges, sharing resources, helping each other, and chatting about all things front-end!
Join our Discord