


Design comparison
SolutionDesign
Solution retrospective
What are you most proud of, and what would you do differently next time?
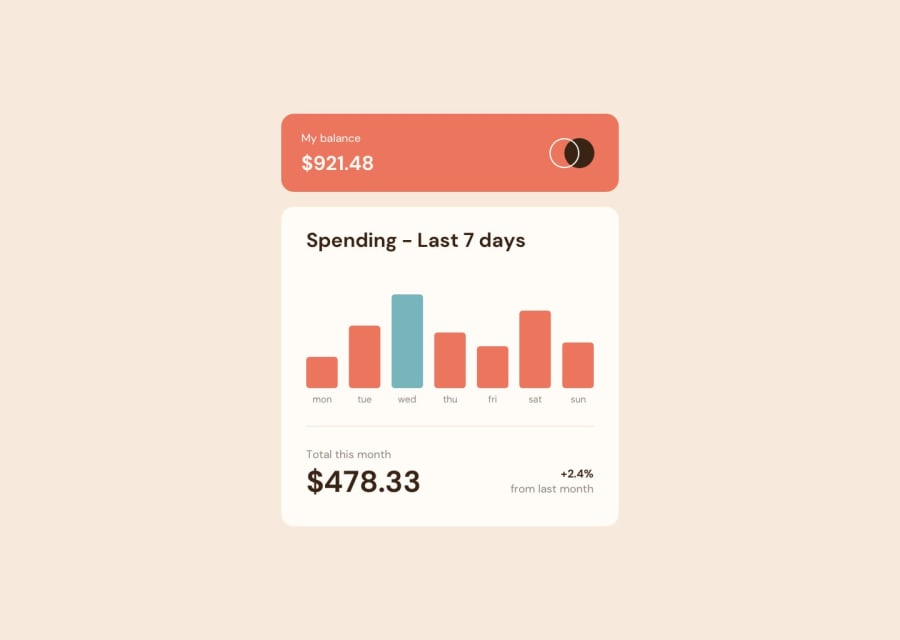
Dinamically change the height of the chart bars after modifying the data.json file.
Steps in JS:
- Identify the highest value of the week //52.36
- Set the value as the maximum height of the chart (in
px,rem, etc.). //52.3610rem - Adjust the rest of the values relative to that maximum height by applying basic math. //17.453.33rem // 34.916.66rem ...
The animation for maintaining the hover bar color when clicking on it. I ended up using opacity values of 1 and 0.7.
What specific areas of your project would you like help with?I don't understand the warning Buttons must have discernible text.
Also about lightness modes, just feedback and maybe more understandable ways to do it :)
Community feedback
Please log in to post a comment
Log in with GitHubJoin our Discord community
Join thousands of Frontend Mentor community members taking the challenges, sharing resources, helping each other, and chatting about all things front-end!
Join our Discord