


@elaineleung
Posted
Hi Patrick, well done putting this together, and yes, working with JSON is actually not so hard! 🙂
I'm viewing this on Firefox, and I did try to click around on the timeframe labels, but the information did not get changed, so I tested it on Chrome, and everything worked. You may want to try it out on Firefox too if you have it, and if you want to try another way for getting JSON data instead of using import, you can use fetch(), which is what I used in my solution.
Some other quick comments I have:
-
I noticed you using
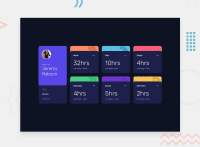
position: absolutewithtransformfor centering the component; you can try adding in the body selector eitherdisplay: gridwithplace-content: centeror usedisplay: flexwithalign-items:centerandjustify-content:center, and since the body selector already hasmin-height: 100vh, that should work right away after removing all the absolute positioning properties. -
I think at around the 800-900px breakpoint, the component becomes rather small with some white space around the sides, and the text gets hard to read. Maybe you can try another grid layout, or remove the fixed width you have on the cards, which is not really needed anyway because you're using grid-template-columns, and that should set the column automatically if the right values are used, and that can also allow for better responsiveness!
That's all the quick comments I have, and if you're interested in another JSON challenge, you can check out the expenses chart component. Happy coding!
Marked as helpful
